Model Setup and Execution
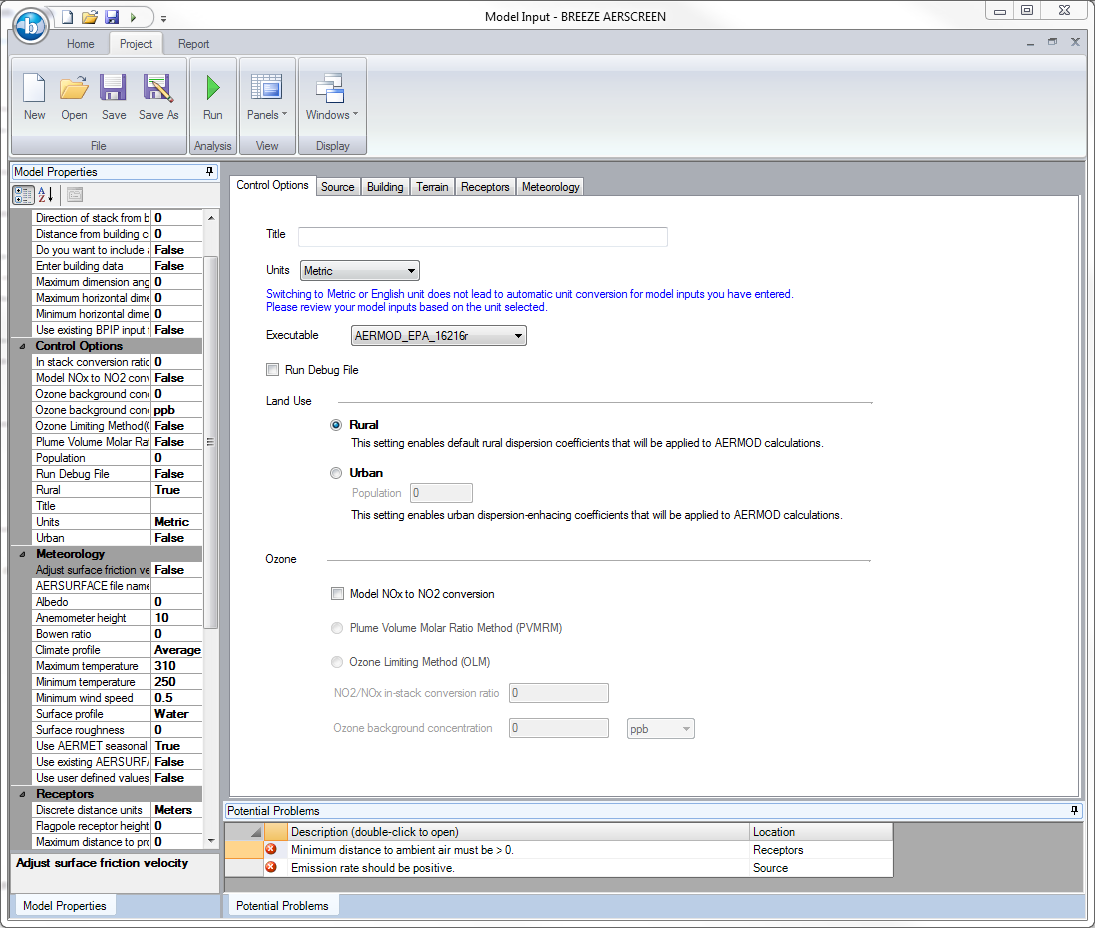
BREEZE AERSCREEN is a simple to use, intuitive screening air quality modeling system designed to streamline the setup, execution, and analysis of a scenario without the complications associated with data entry via a DOS command prompt window. All of the model setup is conveniently done in a series of data entry tabs or in a model properties panel, and a diagnostics panel displays informational messages, warnings, and errors alerting users to potential problems with the scenario. Each message is preceded by a visual indicator to identify the severity of the alert. While informational and warning messages will not necessarily prevent a scenario from successfully completing, error messages indicate that if the run is executed, it will fail. Clicking on a message will take the user to the location within the application that trigged the message.
Meteorology
Entering meteorological data into BREEZE AERSCREEN takes only a matter of seconds. The user can either opt to use a built-in matrix of worst-case meteorological conditions or input specific meteorological conditions. Additionally, for the surface characteristics, users can use AERMET seasonal tables, upload an existing AERSURFACE output file, or use user-defined values.
Model Objects
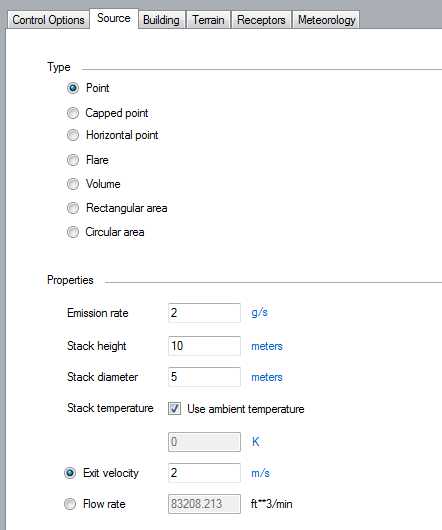
In BREEZE AERSCREEN, information on the source, receptors, and buildings are entered in the respective tabs. For the source, users have the option to choose from a variety of source types and customize the properties accordingly. The receptors may be customized as well, giving the option of using flagpole receptors should users choose. A unit conversion option is also available when entering discrete receptor distances, making it easy to alternate between different units. AERSCREEN allows one building to be included in a run and users can either enter the different dimensions of the building or upload an existing BPIP input file. When a building is included in AERSCREEN, the program will seamlessly and automatically calculate the impact of air flow over and around the building on the pollutant plume exiting the source. For more information about the model objects, please download the product brochure.
Results Analysis
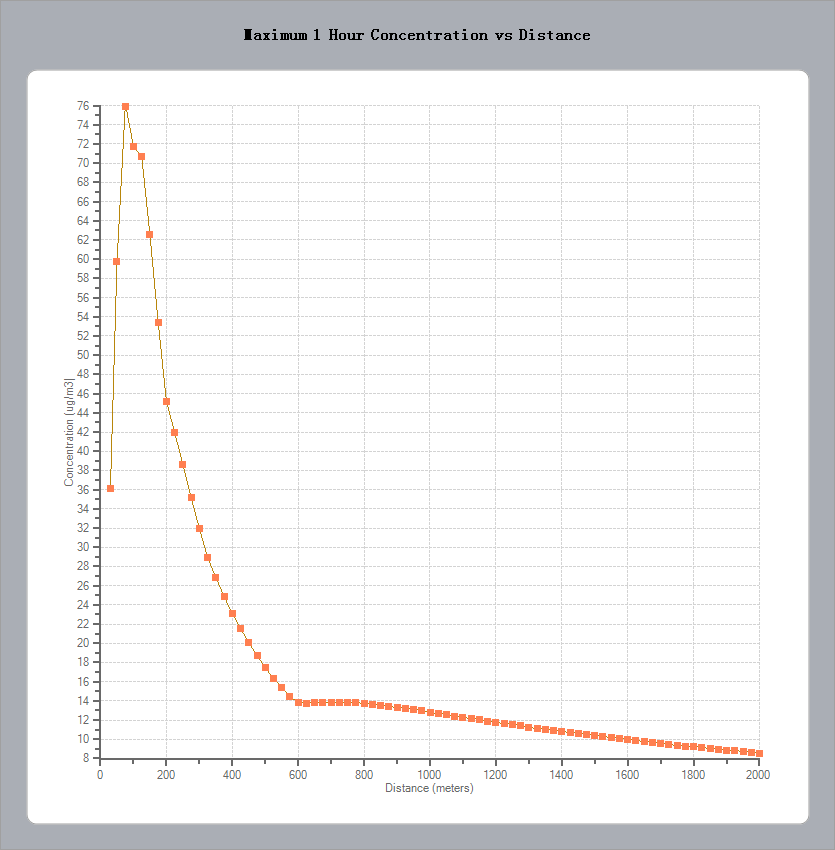
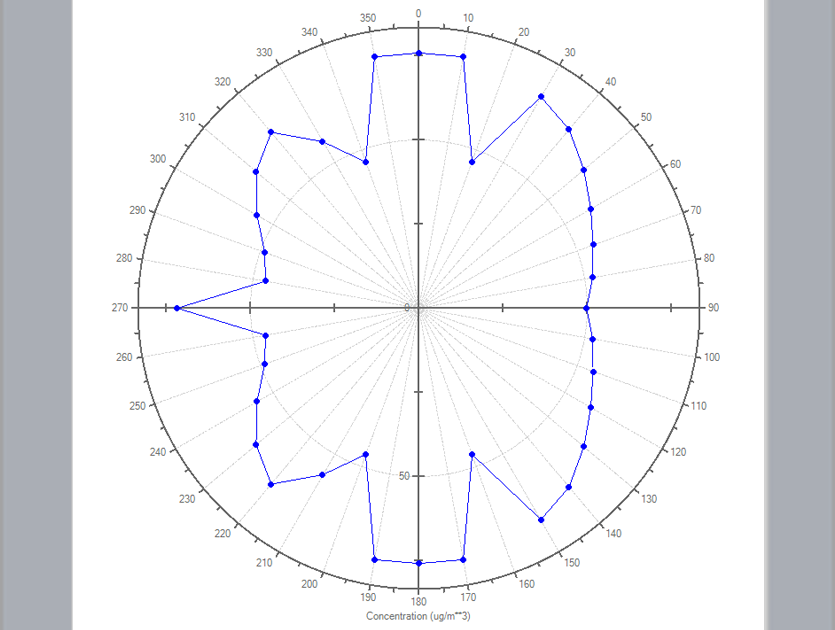
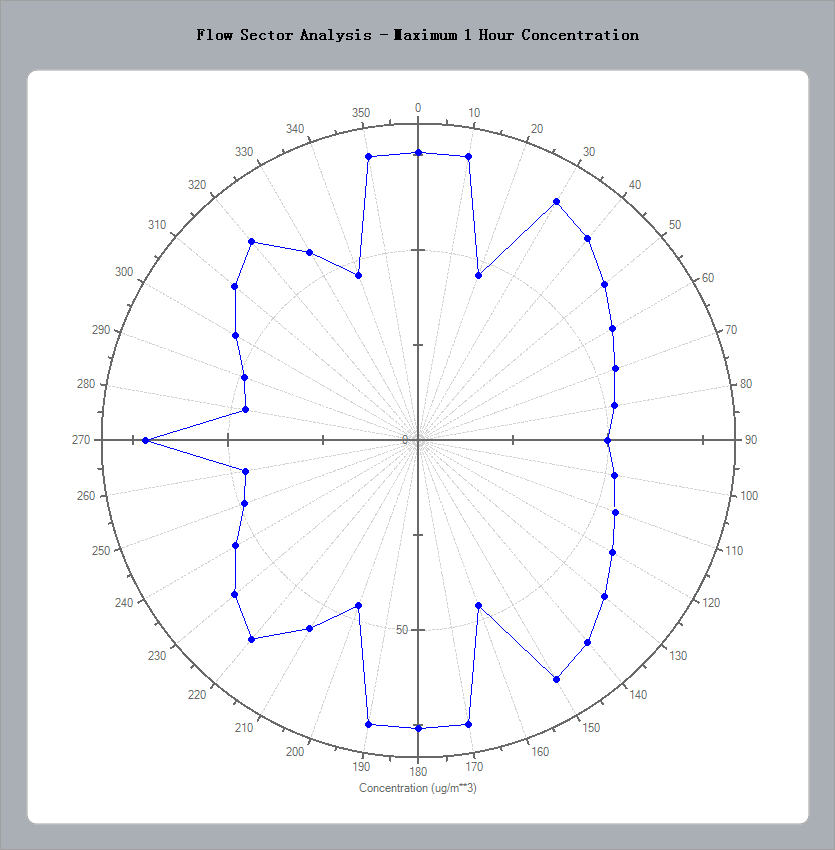
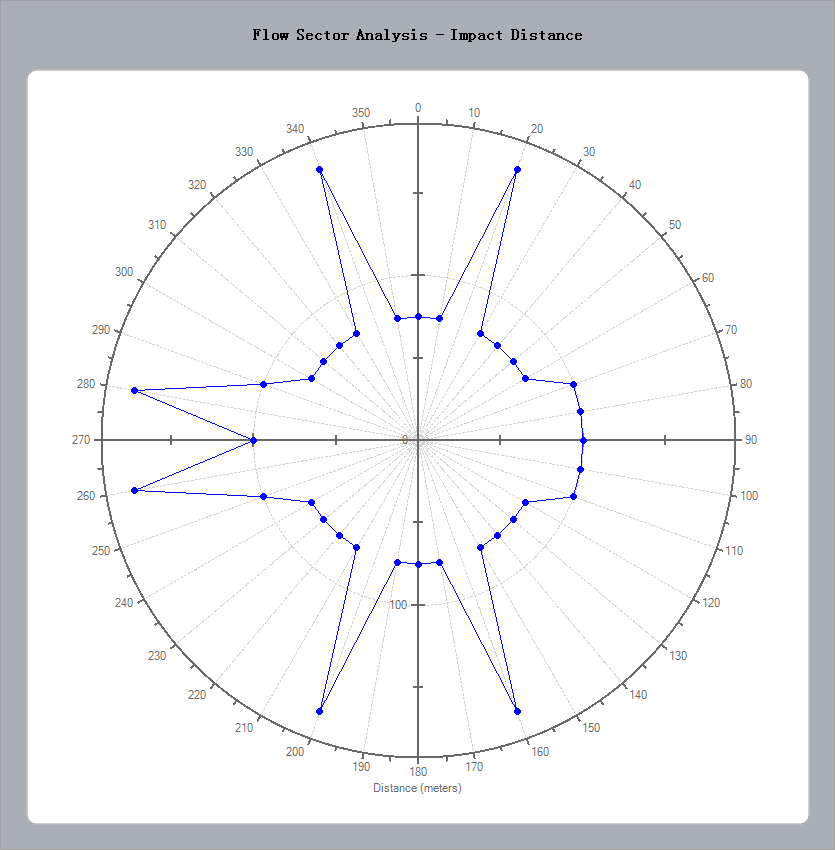
BREEZE AERSCREEN provides multiple graphical and tabular results options to facilitate both analysis and documentation. The results from each model run can be displayed in three different formats: chart, table, and text file. The charts include a concentration vs distance line graph, a flow sector analysis of the concentration, and a flow sector analysis of the impact distance. To see examples of these output options, download the product brochure.